The Chart Request
The purpose of the chart request is to provide a specific market data information from a chart on an instrument, for example a quote price or an indicator value.
The chart format
'Field'!Symbol_ChartResolution(Date)
op – Open
hg – High
lw – Low
ls – Last
ps - Previous Settlement
vl – Volume
oi – Open Interest
ts – Timestamp Update
Indicator or Indicator.IndicatorComponent - the indicator value or a specific component of the indicator when the indicator is split into components, e.g. ‘ALGT.Alligators Jaw’, where ALGT is the Alligator indicator, and Alligators Jaw is one of the 3 components of the indicator.
The Symbol parameter is the contract symbol used in QST for different types of instruments (futures, options, spreads).
Note
For futures, you can use either the standard symbol, e.g. EGCV20, or the corresponding perpetual symbol, e.g. EGC1- .
Likewise, for future spreads, the standard symbol can be used, e.g. ZCZ20:H21[SP], or the corresponding perpetual symbol, e.g. ZC1-:2-[SP] .
While for option instruments, you can either use the actual symbol of the option, e.g. EWZ20C3400 (E-mini S&P End of Month options), or using the underlying symbol instead, e.g. ESZ20{EW}C3400 .
Daily
Weekly
Monthly
Quarterly
Ticks
Volume
Price Change
Price Range
Xminute(s) - e.g. 1minute, 5minutes, 15minutes, 30minutes
Xhour(s) - e.g. 1hour, 2hours, 6hours
yyyy-MM-dd (only for daily charts)
MM-dd-yyyy (only for daily charts)
a single positive value which can represent the number of trading days ago (not calendar) since the present time (for daily charts) or the number of bars in the past (e.g. intraday charts).
Note
You can only request one specific piece of information per chart request, e.g. you can request the high price or the low price but not both in the same chart request. Likewise, you can only request that information from a specific date/bar per chart request.
Examples of chart request
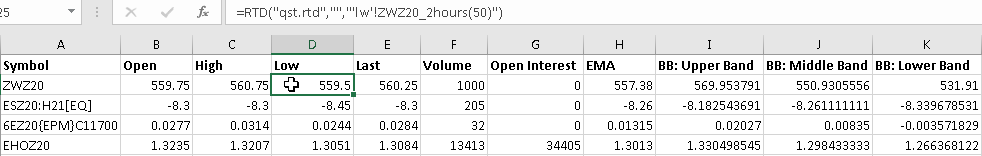
Requesting the low price from a 2-hourly chart on ZWZ20 (CBOT Wheat) future, from 50 2-hour bars ago:
=RTD("qst.rtd","","'lw'!ZWZ20_2hours(50)")
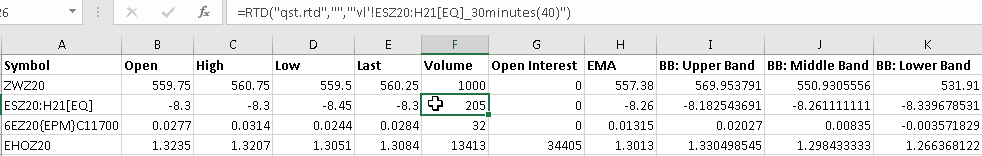
Requesting the volume, from a 30 minutes intraday chart on ESZ20:H21[EQ] (CME E-mini S&P) future spread, from 40 30-minute bars ago:
=RTD("qst.rtd","","'vl'!ESZ20:H21[EQ]_30minutes(40)")
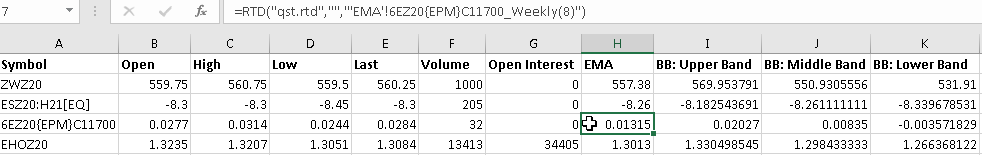
Requesting the Exponential Moving Average indicator value, from a Weekly chart on 6EZ20{EPM}C11700 (CME EUR/USD Premium) European option, from 8 weekly bars ago:
=RTD("qst.rtd","","'EMA'!6EZ20{EPM}C11700_Weekly(8)")
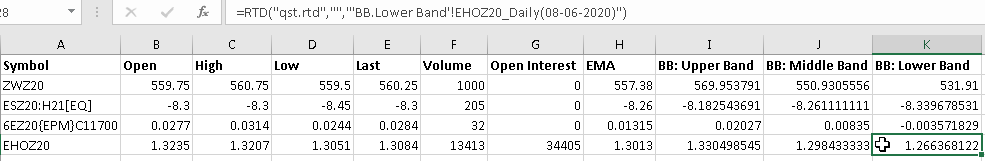
Requesting the Lower Band component value of the Bollinger Bands indicator, from a Daily chart on EHOZ20 (NYMEX NY Harbor ULSD) future, on the trading date 08/06/2020:
=RTD("qst.rtd","","'BB.Lower Band'!EHOZ20_Daily(08-06-2020)")